I'm Clare, and I work alongside Claire in the Environmental Statistics and Reporting team at Defra, supporting the delivery of the UK and England Biodiversity Indicators.
On 3 May we published the new indicators of species abundance in England as an official statistic in development.
In this post, we will share more about what the species abundance indicator tells us, and how you can get in touch to give us feedback.
About the indicator
The indicator covers two measures of species abundance.
The first is the all-species abundance indicator. This includes all species for which we have suitable data. It aims to summarise trends in abundance for the broadest possible set of organisms that are representative of English biodiversity, although the species coverage is limited by data availability.
The second is the priority species indicator. This includes those which are deemed priority species and have been identified as being of conservation concern.
When fully developed, the all-species abundance measure will be used to track the government’s progress towards meeting the statutory targets of halting the decline in species abundance by 2030, and then reversing these declines by at least 10% relative to 2030 by 2042.
The indicator includes a range of species groups which, between them, depend on the majority of habitats found in England. This means that action to deliver the species abundance target will need to focus on the recovery of a broad range of habitats. Improvements to these habitats will benefit all the species that depend on them, including those not included in the indicator.
Current assessment of the indicator
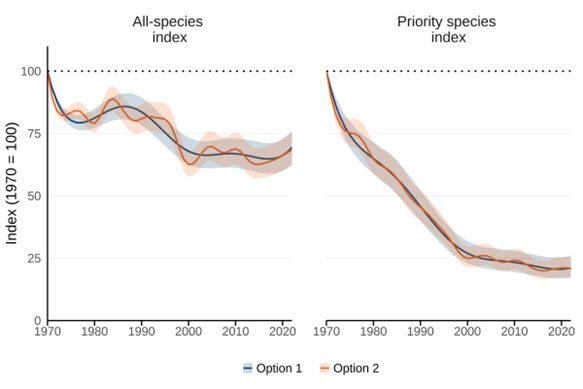
For both the indicators, two possible versions are presented, one with smoothing over a ten-year timescale, and one with a three-year time scale. Smoothing is a standard practice to reduce the impact of between-year fluctuations, such as those caused by variation in weather, to make underlying trends easier to detect. A greater degree of smoothing may provide a clearer view of the underlying long-term trend, while a lesser degree of smoothing preserves the shorter-term patterns in the data.
We use an index of relative abundance to reflect the average change in species abundance across the different species groups compared to their starting value in 1970. If, on average, species experienced a doubling in abundance, the indicator would rise to 200, if they halved it would fall to a value of 50.
The all-species indicator currently shows that by 2022, the index of change in relative abundance of species in England declined to around 69% of its 1970 value.
More recently, between 2017 and 2022, the relative abundance index did not change significantly.
The priority species indicator shows that by 2022, the index of change in relative abundance of priority species in England declined to around 21% of its baseline value in 1970. More recently, between 2017 and 2022, the relative abundance index of priority species did not change significantly.
We are now seeking your feedback on how to improve the indicator
Given the complexity of producing a combined species indicator on this scale and its importance to our statutory targets, we are seeking advice from experts, stakeholders and users, to improve future releases.
We are particularly keen to get feedback on the novel methods used in the development of this indicator, and in particular, what levels of smoothing you think are most appropriate.
To provide feedback, please email the Environmental Statistics and Reporting team at enviro.statistics@defra.gov.uk.
We acknowledge that there are many species and groups for which sufficient abundance data is not currently available, and so are excluded from the indicators, including fungi, non-vascular plants (bryophytes and algae), microbes, amphibians and reptiles, and terrestrial invertebrates (other than moths, butterflies and bumblebees). New data sets are likely to become available in the future which could be useful to incorporate into the indicators to represent species abundance more robustly.
To address this, we will monitor new species abundance data that may become available on an ongoing basis. If it meets the criteria outlined in the statistics release, possible changes to the list of species in Schedule 2 may be considered and consulted on to ensure it would not make the indicator easier to achieve.
If you're interested in reading more stories like this one, please subscribe to receive an email notification whenever a new post is published.
1 comment
Comment by Chris Coopey posted on
Hello DEFRA I was interested in your invitation to offer suggestions to help the countries well being.
Would it not be possible to follow Holland and Singapore and reclaim land from the sea.With all the earth and rubble from HS2 ,cross rail,Heathrow third runway and countless building sites,surely the earth and rubble could extend our coast the land could then be used for farming,such as grow wheat,barley flowers just as the Dutch do.Its the same sea as Holland isn’t it worth considering?