Nearly all the food we eat, clothes we wear, and cosmetics we use contain commodities grown in fields and forests around the world. Our consumption of these items creates a demand for their production. This, in turn, can drive deforestation, put pressure on scarce water supplies, and lead to excess use of fertilisers and pesticides.
These activities can destroy and fragment habitats, alter and degrade freshwater ecosystems, and directly impact all life in the surrounding area.
The environmental impact of our consumption habits is becoming more widely understood. This growing interest is reflected in internationally-agreed consumption targets in both the Global Biodiversity Framework and the Sustainable Development Goals. To meet these international objectives and develop effective policies to ensure consumption is sustainable, governments need to understand these environmental impacts, where they are happening, and what is causing them.
I'm Ethan and I'm an Evidence Specialist in the Ecosystems Analysis team at the Joint Nature Conservation Committee (JNCC). In this post, I'm going to tell you about our recently updated tool, the Global Environmental Impacts of Consumption (GEIC) Indicator, which can help us answer this question.
The GEIC indicator tool provides information on the environmental impacts of consumption habits
When products arrive in our shops and on our doorsteps, they can look very different to the raw ingredients that were used to make them. Most products are made up of many parts, and these can move thousands of miles through many countries before reaching their final destination.
The average consumer is so far removed from the production process, both physically and conceptually, that it is hard to imagine where their products are from, let alone the environmental impacts resulting from their production. This is also true for the academics and governments working to monitor and reduce the environmental impact of our consumption.
This is where modelling tools like the GEIC Indicator come in.

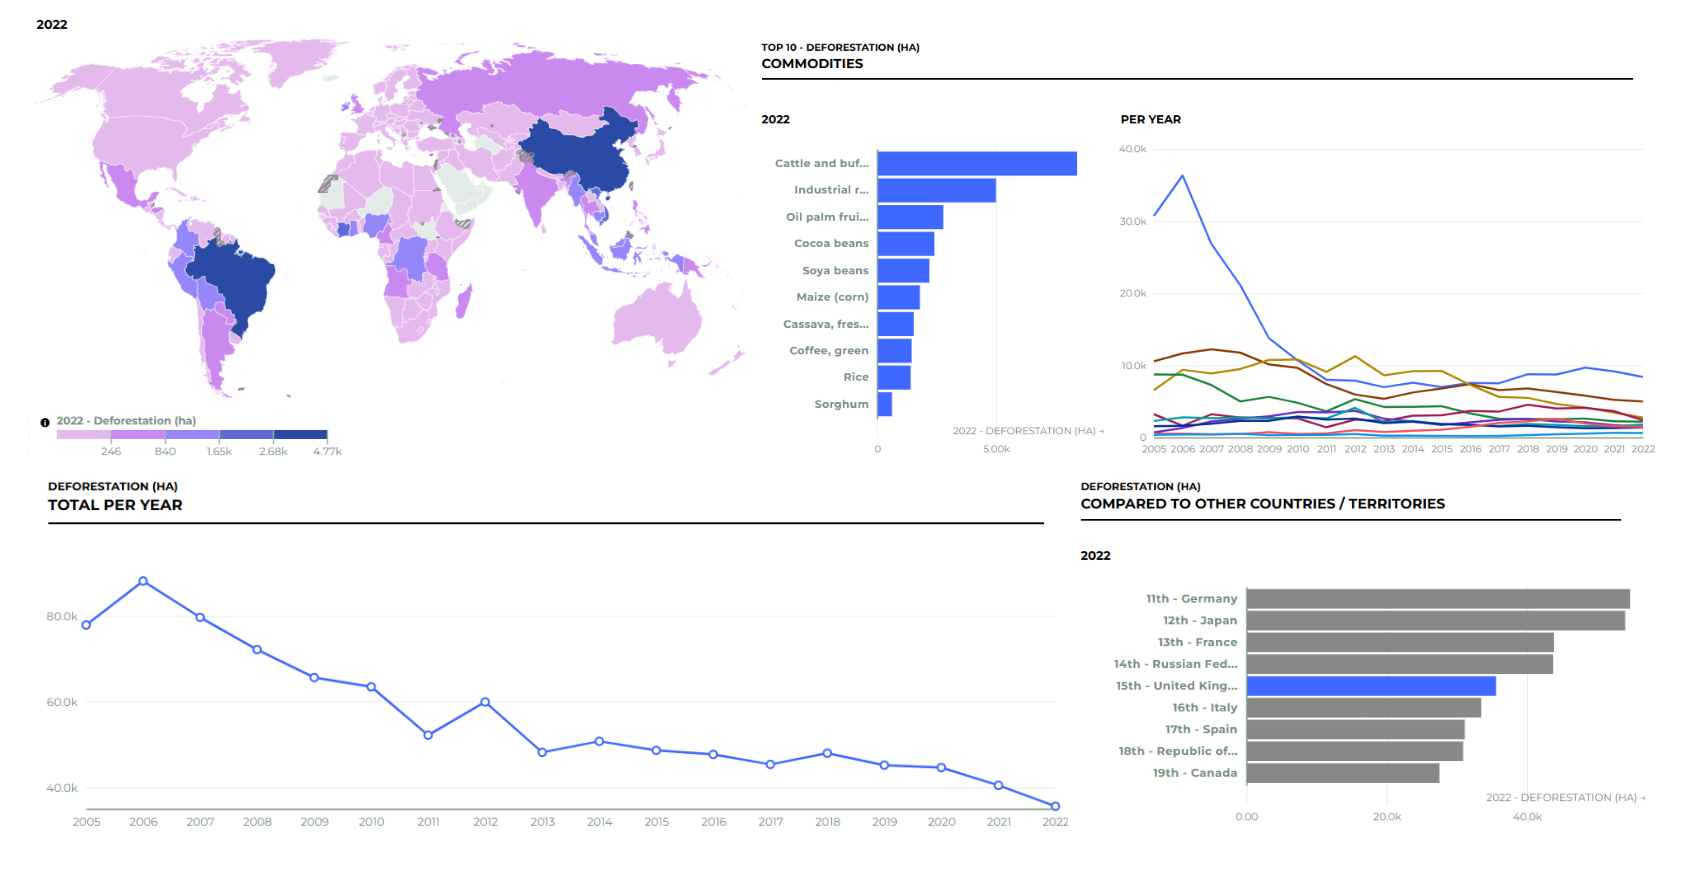
Clockwise from top-left: a map showing relative areas of deforestation between producing countries (darker blue indicates larger area); a comparison of deforested area associated with the top-10 deforesting commodities consumed in the UK, in 2022 and over time; total UK consumption-related global deforested area over time; a comparison with other countries/territories.
It’s a Defra-funded tool, jointly developed by JNCC and the Stockholm Environment Institute at the University of York. It provides data on the biodiversity loss, water use, and deforestation associated with a country or territory’s consumption, and can be visualised through an openly available dashboard.
The indicator combines physical and financial data on trade between countries with various datasets that quantify the environmental impacts of growing the traded commodities. This models where a particular commodity is likely to have come from, and estimates what environmental impacts occurred, and where, as a result of its production.
The results can be filtered by impact type, year, producing country, and commodity. For example, the tool can tell you that the UK's consumption of bananas in 2022 resulted in an estimated 68.3 hectares of deforestation in Colombia.
It can also be used to answer bigger questions, like how much water was used globally to grow food for the UK? How is this changing over time? What commodities are using most of the water? Which countries are most heavily impacted?

The indicator is updated annually
Each year, an updated version of the GEIC Indicator is released alongside the wider collection of UK Biodiversity Indicators. This year’s update went out just before Christmas, providing users with an extra year of data in the time series. Alongside this, a new biodiversity metric, the ‘LIFE Metric’ was added. This is a more complex measure of biodiversity impact than was previously available on the dashboard. It maps where species are likely to go extinct as a result of land-use change.
We are also delighted to announce that in this year’s release, the GEIC Indicator has been upgraded from an Official Statistic in Development to a fully-fledged Official Statistic. While this has involved no change to the methods or underlying data, it recognises that the indicator has reached a level of stability and is compliant with the Office for Statistics Regulation's Code of Practice.
The GEIC indicator tool supports international environmental targets and reporting
The Kunming-Montreal Global Biodiversity Framework (GBF) is an international treaty agreed by the 196 parties of the Convention on Biological Diversity. It is made up of 4 global goals and 23 targets, each designed to facilitate a transition to a nature-friendly world. Each target has a specific set of indicators that can track a country’s progress towards this outcome.
In 2022, the GEIC Indicator was included as a component indicator against Target 16, which is to enable sustainable consumption choices to reduce waste and consumption choices to reduce waste and overconsumption. Component indicators are a list of optional indicators that, together with the mandatory headline indicators, cover the goals and targets of the GBF. Due to the complexity of measuring the impacts of commodity consumption, Target 16 does not have a headline indicator, placing added importance on its component and complementary indicators.
National governments can use the GEIC Indicator dashboard, alongside the other component indicators, to determine the impact their country’s consumption is having. This can help them to understand and report on their impacts, as well as take action to improve the sustainability of their consumption. For instance, by highlighting impact hotspots, both in terms of commodity type and producing country, consumption policies can be directed to where they will be most effective.
Without global agreements on sustainable consumption, like Target 16 of the GBF, and ways to monitor the impacts of unsustainable consumption, like the GEIC Indicator, it is impossible to make collaborative, informed decisions that move us towards a world that consumes responsibly.
To find out more about the indicator and related work:
- use the dashboard to explore the data yourself
- visit our website for a general overview and to read our sustainable consumption reports
- watch last year’s webinars on technical, UK policy, or Global Biodiversity Framework perspectives.
Leave a comment