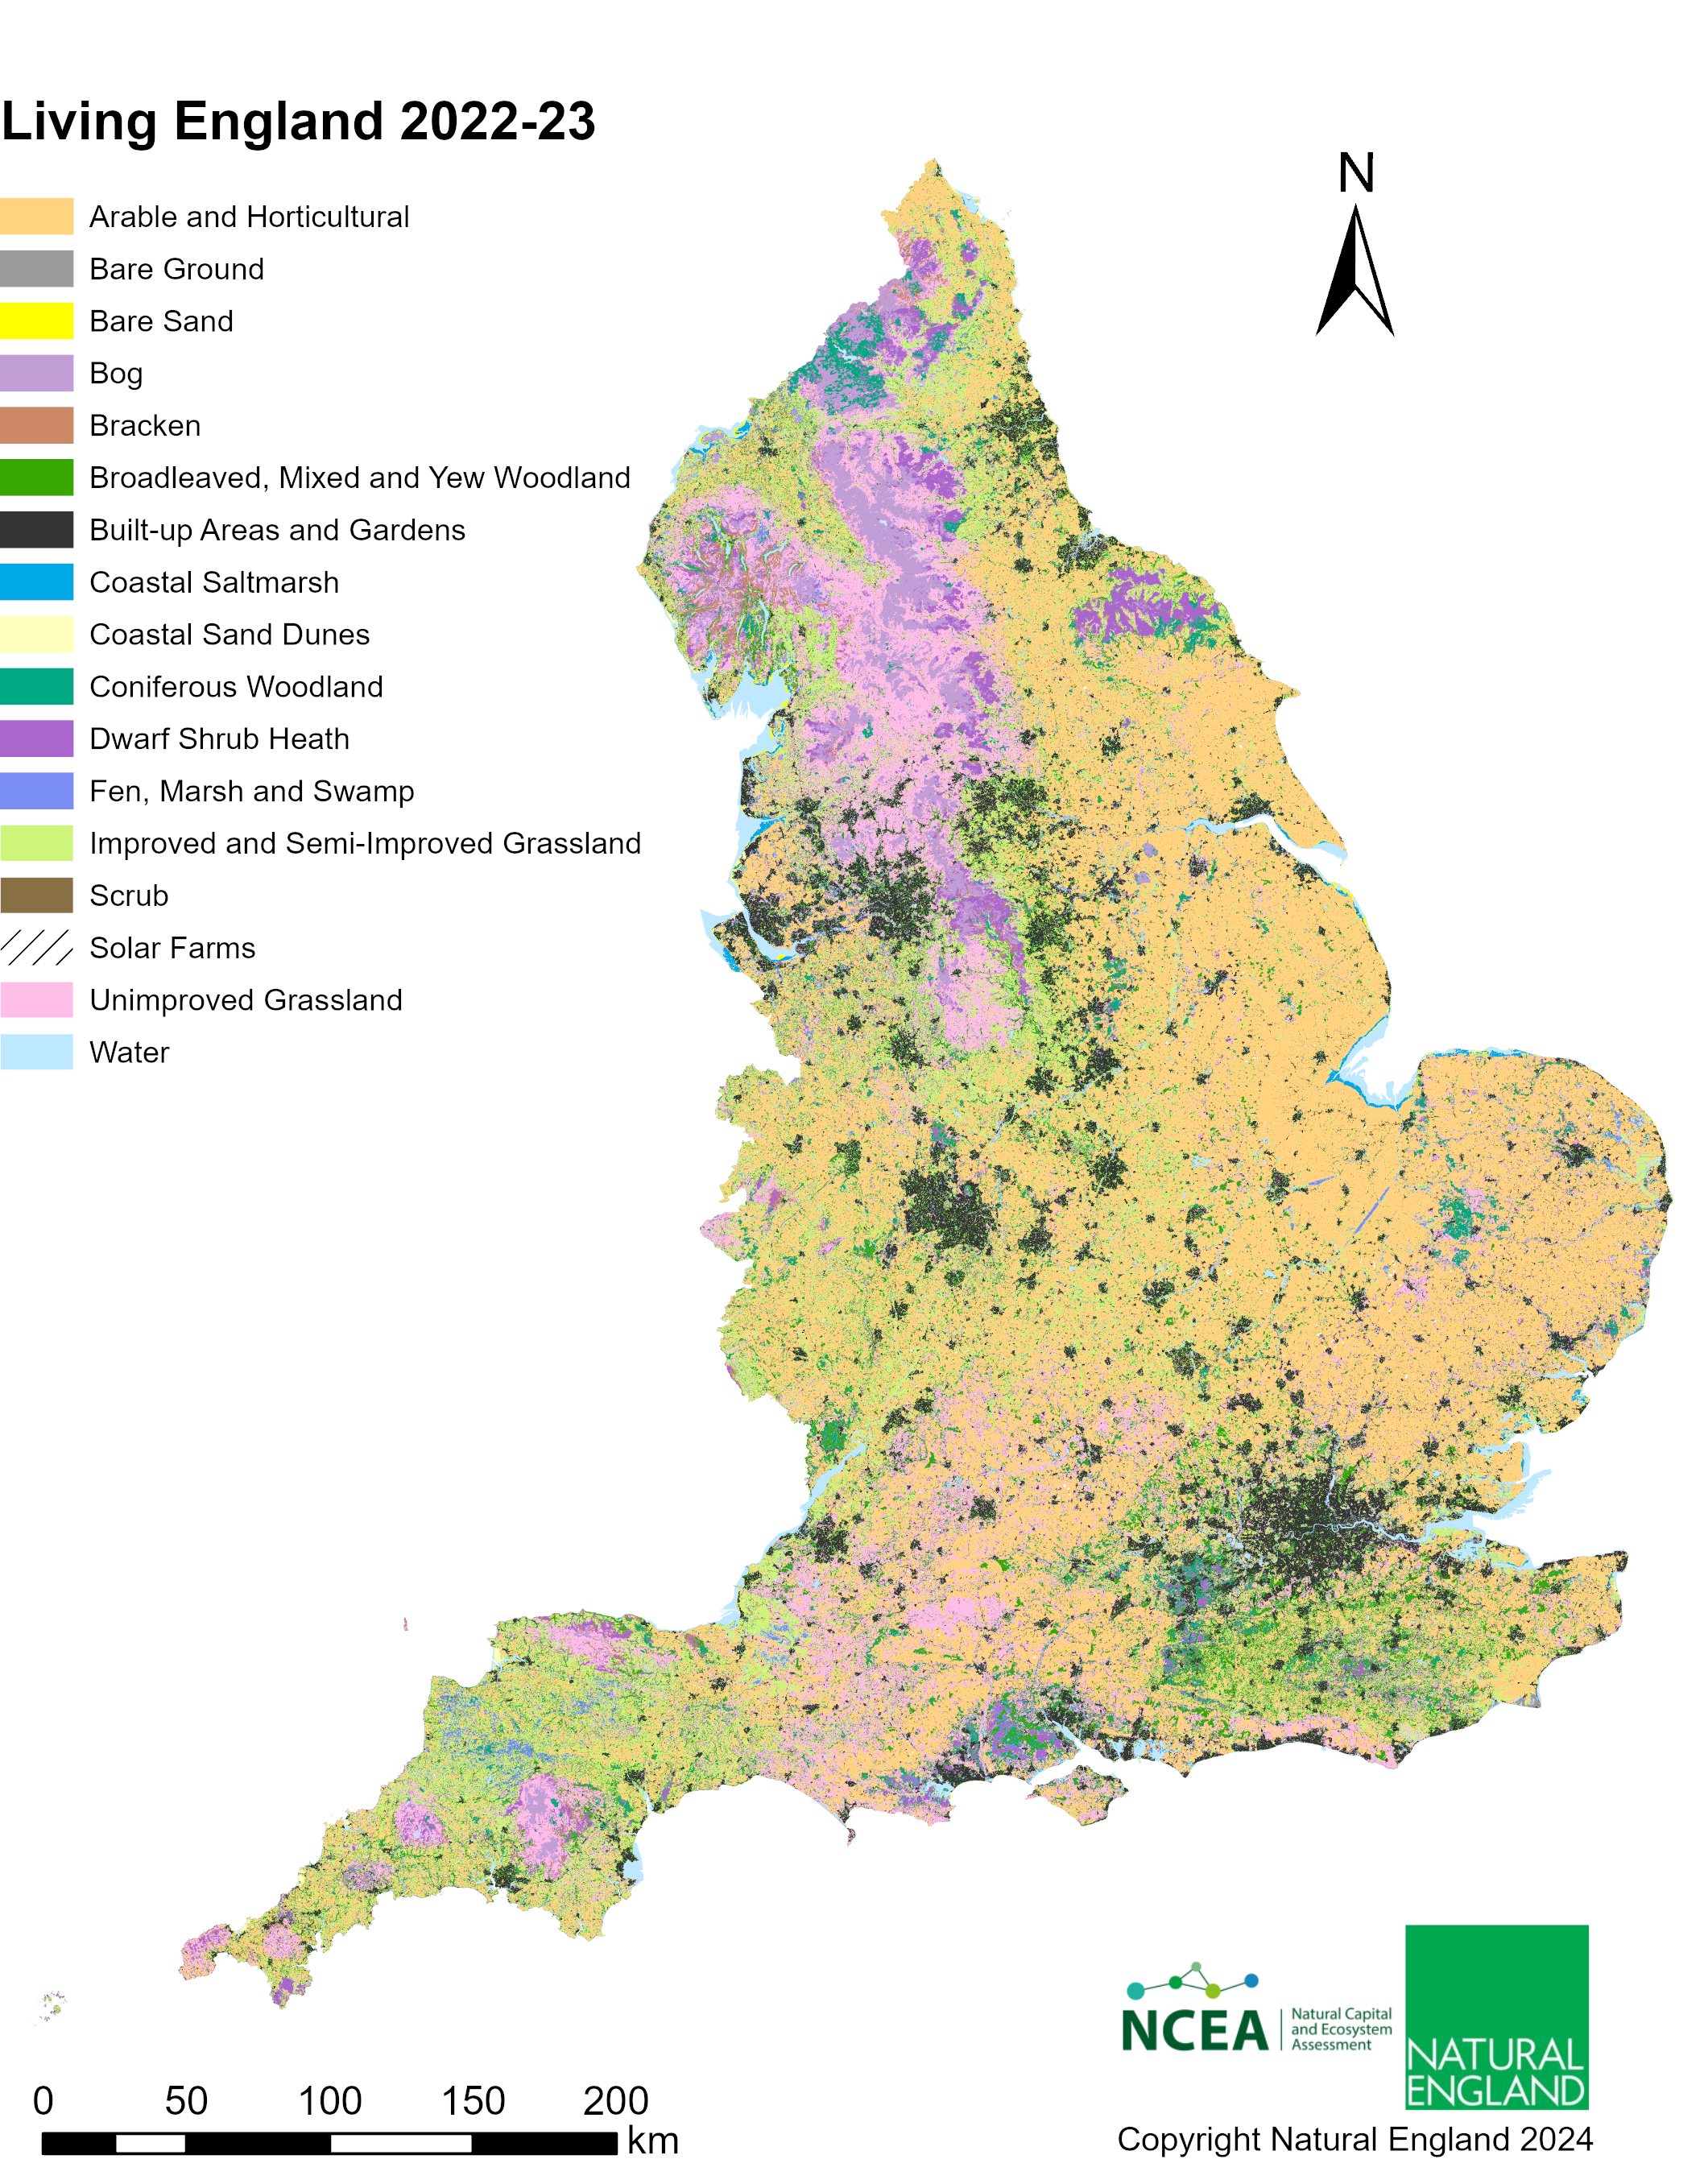
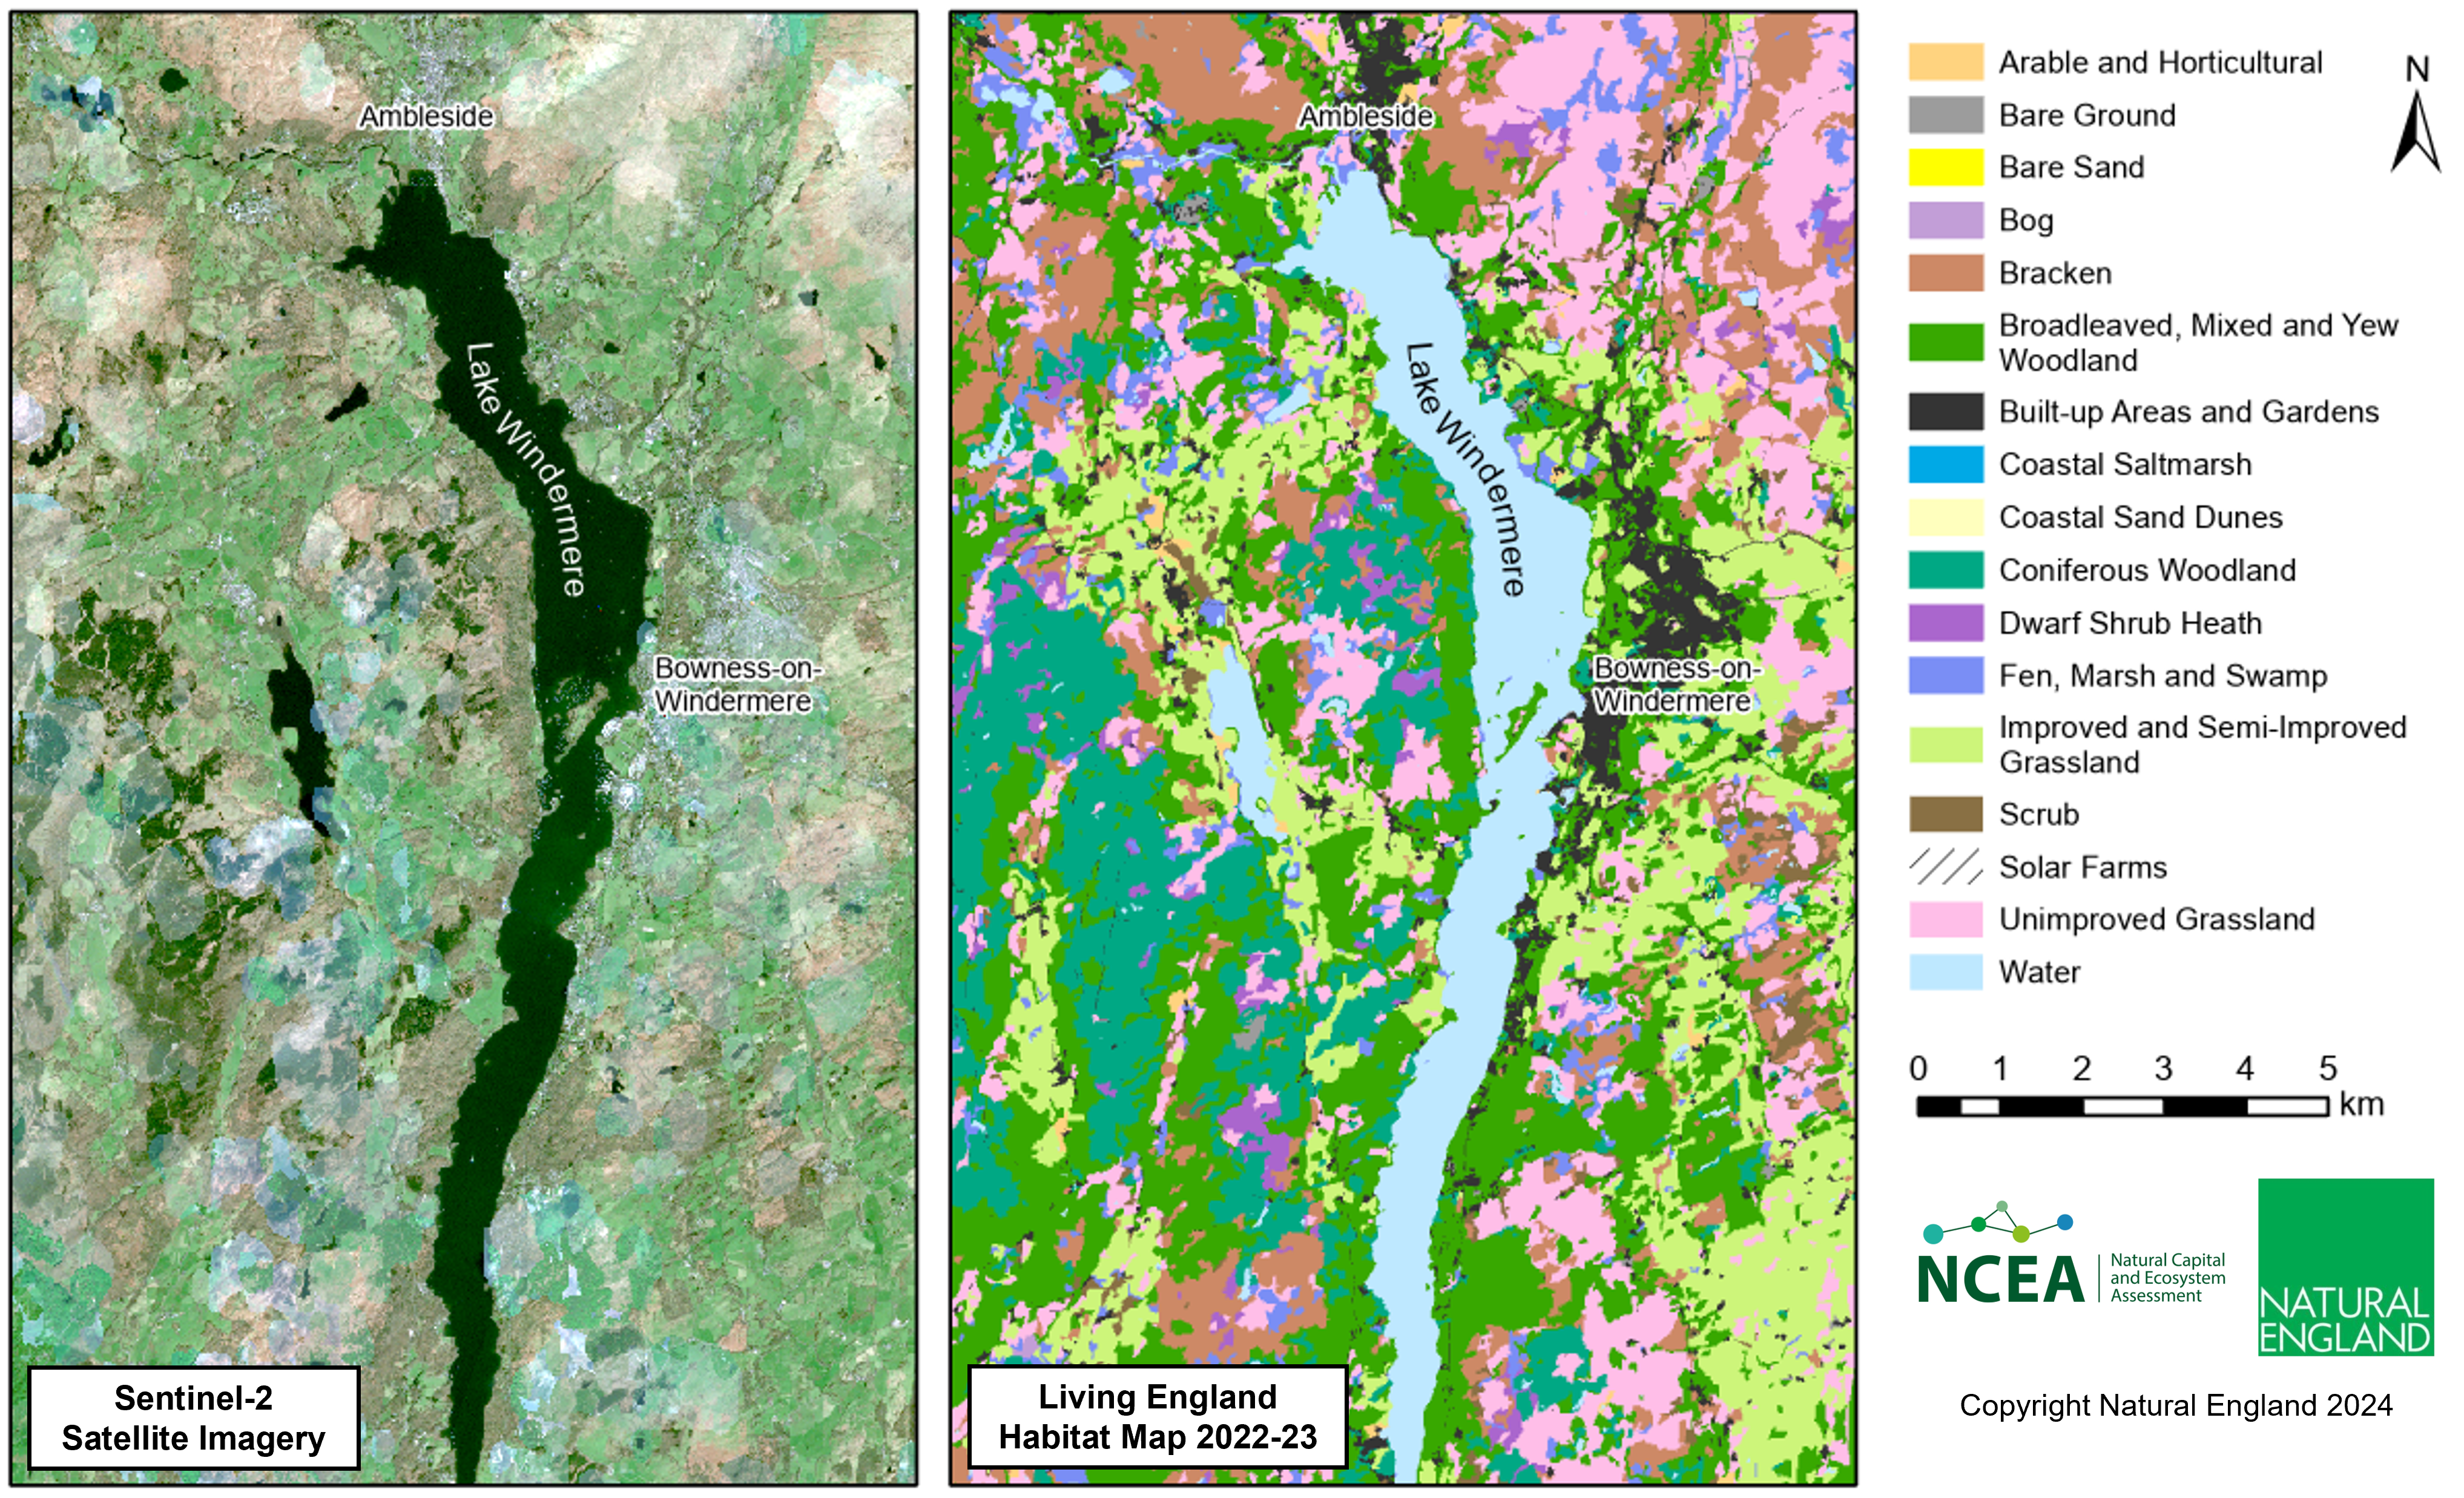
Living England is a national scale habitat map, freely available to everyone.
While more detailed maps exist for specific habitats and local areas, Living England is distinctive in its geographic coverage, offering a basis for mapping where localised data is lacking.
The Living England team have just published a major update, meaning that the map is more reliable and user-friendly than ever before.
I'm Amy Woodget, the Communications and Engagement Lead for the Living England project. In this post, I'm going to introduce the latest release of Natural England’s ‘Living England’ dataset – a digital map providing information on England’s broad habitats.
The map has been developed by Natural England through the Natural Capital and Ecosystem Assessment (NCEA) programme and partially funded by the Environmental Land Management schemes.
The NCEA is Defra’s largest research and development programme, undertaking a nationwide survey of England’s land, coast and sea. It aims to build a ‘whole system’ picture of the state of our natural environment, and Living England forms a key part of this endeavour, as we’ll explain in this post.
For more information on the NCEA programme, please read our previous blog post.
The Living England map shows how habitats vary across England
The latest version of Living England shows the extent and distribution of 16 different habitats across England for 2022-23. The bespoke habitat types we map are aligned with the UK Biodiversity Action Plan’s broad habitat classification scheme.
From Living England, you can see that arable and horticultural land is the most common habitat, covering an estimated 38% of the country.
Types of grasslands, and built-up areas and gardens, also cover large swathes of England (29% and 11%, respectively). Coastal sand dunes and areas of bare sand cover the smallest areas, at less than 1% each.
Future versions of the map will aim to show us where habitats are growing or diminishing in size, in response to changes in the climate or land use. We’re aiming to release the next update in 2026.

Living England is used widely for environmental policy and monitoring
The map is already being used within and beyond Defra for environmental monitoring, conservation and land use planning. For example, it feeds into Natural England’s Priority Habitats Inventory, Green Infrastructure mapping, Local Nature Recovery Strategies and the England Peat Map.
It provides essential data for assessing the quantity, quality and connectivity of England’s habitats for the Environmental Improvement Plan. And it’s helping to inform the spatial prioritisation of agricultural schemes by Defra’s Environmental Land Management teams.
Elsewhere, Living England makes an important contribution to JNCC’s NCEA Landscape Evaluation project. This project produces and analyses satellite imagery to help assess how habitats are changing over time. It aims to help non-specialists identify substantial changes in habitat condition, for example from vegetation removal or burning, and more gradual changes like the impacts of habitat restoration activities.
Living England provides important baseline data on the expected location and classification of habitats, so that habitat changes observed from satellite imagery can be more easily interpreted.
JNCC’s Landscape Evaluation project has great potential as a decision-support tool, helping to reduce costs by enabling more effective targeting of environmental surveys and management actions.
The Living England map is also being used outside of government – something made possible by its free availability under Open Government Licence.
Some private sector organisations are using it within tools designed to help landowners meet the government’s new Biodiversity Net Gain requirements.
For example, Map Impact use it to help create their ‘BiodiversityView’ product, which assigns biodiversity scores to different habitats. Verna Earth Ltd use it within their ‘ForestFounder’ app to help identify suitable locations for tree planting, to offset biodiversity loss caused by developments.

Earth observation imagery, geospatial data and field surveys are essential inputs to Living England
Living England uses a machine learning model (an artificial intelligence tool) to map England’s habitats. For this to work well, we need to collect:
- lots of high-quality satellite imagery (like that used in Google Maps)
- a variety of other geographical data (e.g. about soils, climate and elevation)
- plenty of habitat data collected on the ground by our specialist field survey teams
Once we have this information, we teach the model to make connections between the known habitat type (established by field survey) and the satellite imagery and geographical data for the same location.
Essentially, the model learns what each habitat looks like in the data. The model can then use this knowledge to predict which habitat types are present even where we don’t have field data.
Importantly, we also spot-check the predicted habitats with some of the field data to check that the model is getting things right.
Living England 2022-23 features a range of important updates
The latest release of Living England is produced using a new method. The improvements we’ve made include:
- standardising methods, to allow us to compare this version of the map with future ones and see how habitats are changing over time
- a substantial increase in the amount of field data we use to train and check the machine learning model, allowing us to improve our overall mapping quality
- more accurate delineation of discrete habitat areas
- a ‘reliability’ layer explaining how much confidence we have in the habitat prediction for any given area (from ‘very high’ to ‘very low’)
- new national mapping of solar farms
- improved mapping of water and urban areas thanks to integration of the Ordnance Survey’s MasterMap data
- improved mapping of rarer habitat classes, like scrub, due to integration of the Environment Agency’s national LiDAR topography data

Find out more
If you’re interested in using the habitat maps, these can be downloaded at data.gov.uk and will soon be available on MAGIC too.
For more information on the cutting-edge methods we use to create Living England or how we decide how reliable our habitat areas are, check out our Technical User Guide and the method scripts available on our Github code repository. You can also read about our latest case studies in the recent Natural England Chief Scientist’s Report.
And for any enquiries, please email the team at livingenglandenquiries@naturalengland.org.uk.
With thanks to Anne Stefaniak (Living England Project Manager & Change Detection Lead, Natural England), Elizabeth Mitchell (Senior Engagement and Impact Officer for NCEA, Natural England) and the wider NCEA and Living England teams.
3 comments
Comment by Richard Watson posted on
Can you say when the government's 'rapid review' of the Environmental Improvement Plan will be published? It was due to be completed by the end of 2024.
Comment by bethcarnell posted on
Hi Richard,
Thanks for getting in touch. The Government has now concluded the review of Environmental Improvement Plan (EIP) which is informing the development of a revised EIP. We will publish a statement of rapid review key findings in early 2025, to be followed by publication of a revised EIP.
Thank you,
Beth (The Blog Team)
Comment by Richard Watson posted on
Thank you, Beth. I look forward to reading both the key findings and the revised EIP.